Fermi Problems
Fermi problems are named after Enrico Fermi. They are ‘back of the envelope’ calculations, based on sensible estimates.
Tasks/Ideas
- Leckie Higher Applications Student Book – Chapter 1 – Exercise 1A
- To hear a bit of Fermi working out in action, listen to the following clip for the BBC’s More or Less. The Fermi bit starts around 7 minutes, 22 seconds. Has the number of periods a woman has in her lifetime quadrupled?
- The University of Bristol has a wonderful series of Fermi problems. To download the booklet you must register for a free account.
Worked Example
A food manufacturer produces 500 litres of soup per hour. The soup is sold in steel cans with a cylindrical shape.
The soup cans have a diameter of 6.5cm and a height of 9.8cm. The manufacturer must buy steel in sheets of 1m by 1m in order to produce the cans.
- Estimate the amount of soup produced in a month. State any assumptions you make.
- Estimate the number of sheets, to the nearest 1000, that the soup manufacturer must buy per month. State any assumptions you make.
See a video going through this example, here: Applying Maths on Youtube.
Type of Graphs
In Higher Apps, there are three main types of graphs that we will use for mathematical models.
Click the links to interact with the graph types.
Tasks/Ideas
- Leckie Higher Applications Student Book – Chapter 1 – Exercise 1B
- Shell Centre – Language of Functions and Graphs – This book can be downloaded for free (Teacher’s Guide and Photocopy Masters) and is a great source of questions. For example:

- St. Matthew Island – An example of how population changes over time.
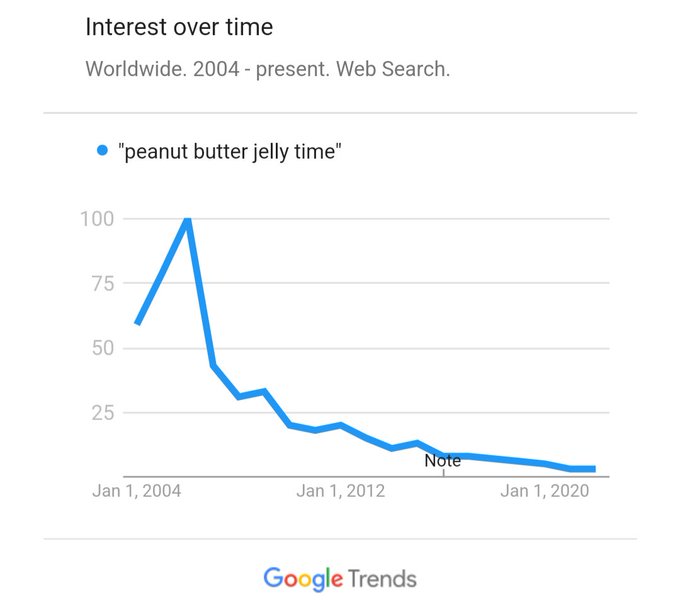
- Google Trends – A good source of graphs about the popularity of different seach terms. For example:
Fitting a Model and Solving Problems
Consider the following graph:

- What could the x and y axes represent? Try to think of lots of different ideas.
- What should a line of best fit look like for this graph? Would it be a straight line, or would it be a curve? Think about your answers to question 1, does your answer change depending on the variable?
Tasks/Ideas
- Leckie Higher Applications Student Book – Chapter 1 – Exercise 1C
- Shell Centre – Language of Functions and Graphs – The exam questions at the start of the booklet are useful here.
- An excellent collect of modelling problems can be found here: https://www.cimt.org.uk/projects/mepres/core-maths/P1/index.htm