I’ve been thinking about brass instruments quite a bit recently. I took my daughter to a workshop by Travelling by Tuba, and it got me thinking about the lengths of various brass instruments compared with their length. A French Horn, for example, is well over 3 meters of pipe nicely wound up. There’s a clear relationship between length and pitch: the longer the instrument is, the deeper the note it makes. But is the relationship linear, or something else?
This reminded me of an interesting part of the Higher Apps spec:
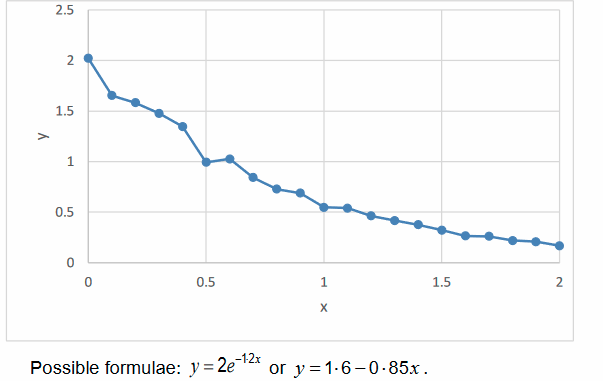
Students may be given a graph and possible formulae and be asked, based on further information, which of the two models is more appropriate. One of the biggest hints that an exponential model is the more appropriate is if the y variable has some sort of limit. For example, in the graph above, if y can never be below zero this strongly suggests the exponential model is the more valid one. I’ve been thinking about what kinds of problems students could look at to understand this.
If you know a bit about music, you may well be aware that the pitch of a note is related to the frequency of the sound wave of the note being produced. If frequencies are always positive, does it not now feel inevitable what the graph of frequency on instrument length is going to look like, and what model is appropriate?
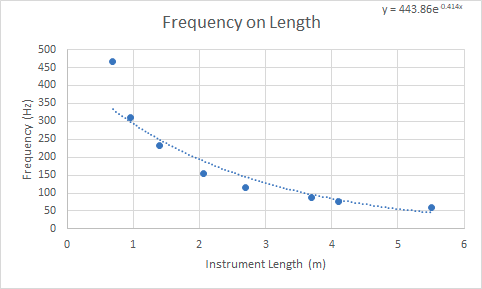
A quick search online finds the lengths of brass instruments and their pitches. If you then lookup the pitch as a frequency and plot a graph a familiar image appears:
If you prefer R Studio, here’s a quick run down on plotting exponential graphs:
brass_data_length <- c(0.69, 0.953, 1.4, 2.06, 2.7, 3.7, 4.1, 5.5)
brass_data_freq <- c(466.16, 311.13, 233.08, 155.56, 116.54, 87.31, 77.78, 58.27)
brass_model <- lm(log(brass_data_freq) ~ brass_data_length)  #Use a linear model, but take the log of the Y variable.
brass_model
# From running brass_model you can see that:
# ln(F)=6.09551 - 0.41389*L
# Taking e of both sides you get:
# F = 443.86*0.6610736654^L
# We'll use this below:
plot(brass_data_length, brass_data_freq)
curve(443.86 * 0.6610736654^x, from=0, to=6, add=TRUE)
So we have model from our Excel graph that looks like:
F=443.86e^{-0.414L}But models need to have consistent units. F is measured in Hertz, and L in metres. How does this check out, and what the heck is the exponential function doing to our metres here? Let’s re-write our model a new way:
F=443.86e^{\frac{-L}{2.415}}Here I’ve re-written the code in the form y=ae^{-x/T}. (Note that 1 \div 0.414 = 2.415.)
First up, a (in our model 443.86) has the unit Hertz. This represents the initial value, though isn’t very meaningful in our model (ever seen a brass instrument with no length?).
T (2.415) is more interesting. It is the answer to the question: How many metres do I need to increase a brass instrument by to cause the frequency of the instrument to drop by the equivalent of dividing by e? That’s a bit of a mouthful, if I’m honest. We’ll see how T was calculated below, but for now let’s note that the unit of T is metres. Hence the index of the exponential is metres/metres, and so has no unit. For this we breathe a sign of relief, because, what would it even mean to have metres as an index?
Let’s calculate T to build up our intuition about it. We’re saying it’s the same as dividing by e, so we’ll start there:
443.86 Hz \div e = 163.28 HzR Studio gave us a slightly different model:
y = 443.86 \times 0.6610736654^xIn plain English, for every metre increased we multiply by another 0.661… So how many times do we need to multiply by 0.661… to get 163.28? i.e., what value of x gives the same answer as just dividing by e? We can set up an equation and solve it:
443.86 Hz \times 0.6610736654^x = 163.28 Hz 0.6610736654^x = 0.36786 Taking logs: x = 2.415So T is 2.415 metres.
In the formula y=ae^{-x/T}, x/T is diving the length of the instrument (in metres) by the number of metres required to divide by e. Essentially it’s scaling the input to work with e… “I don’t care how many metres your trombone is long, how many divisions by e is that?”
The negative in the index is because we’re actually diving by e, not multiplying. We could write the model as:
y=\frac{a}{e^{x/T}}So we have a model with consistent units, as a is the frequency and exponential is unit-less. Result!
I’ve made a worksheet that can be given to students. Side one gives the context about musical instruments and their frequencies, and asks students to predict what the best model would be and to sketch a graph. Part two gives some real data and asks them to produce the graph. Hopefully this will generate some interesting discussions.